A 200 OK at /health means the process is alive, not that your service can handle work.
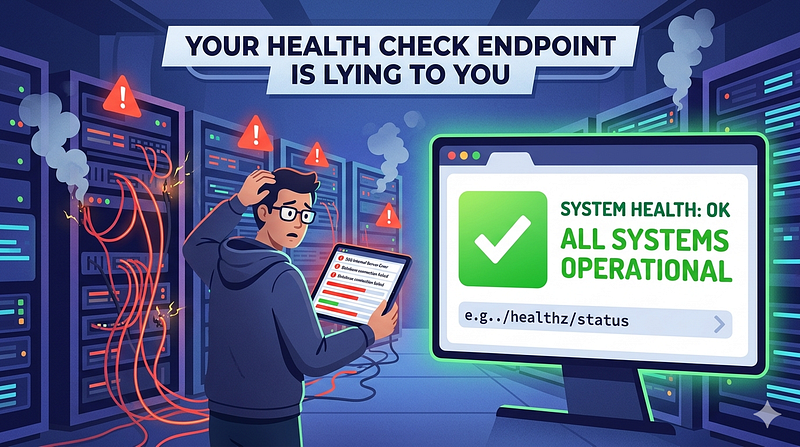
Most engineers ship a health check endpoint that looks like this:
@app.get("/health")
def health():
    return {"status": "ok"}
Congratulations. You’ve built a process-alive detector. If your app crashes, this endpoint stops responding and your load balancer removes it from rotation. That part works fine.
The problem is everything else. That endpoint tells you nothing about whether your service can actually accept and process requests. It doesn’t tell you whether your database connections are live, whether your connection pool has capacity, whether your background workers are stuck, or whether your caches are warm enough to serve traffic without hammering downstream systems. It tells you the process didn’t crash. Kubernetes would have noticed that anyway.
The gap between “process is alive” and “service is healthy” is where outages actually live.
The Check That Always Passes
Here’s how this plays out in practice. You deploy a new service, wire up /health to your Kubernetes readiness and liveness probes, and ship it. Everything looks fine in staging. In production, under load, your database pool hits its limit. New connections start queuing. Query latency climbs from 20ms to 800ms. Your API’s P99 response time blows past your SLA.
Meanwhile, your health check keeps returning 200.
The service is “healthy.” Your monitoring shows all pods in the ready state. Your on-call engineer, watching the dashboards, sees green. What they’re not seeing is that 60% of requests are timing out because every available connection is occupied.
The health check didn’t fail because you never told it to check the connection pool. It checks that the process is running. The process is running. Status: ok.
This is the most common form of health check failure. Not a crash, not a misconfiguration in the obvious sense, but a silent gap between what the check measures and what the service actually needs to function.
Three Probes, One Misunderstood Concept
If you’re running on Kubernetes, you have three distinct probe types available: liveness, readiness and startup. Most teams configure liveness and readiness to hit the same endpoint. That’s the first mistake.
The probes have different jobs.
Liveness asks: should this container be restarted? If the liveness probe fails, Kubernetes kills the container and starts a new one. Use this for detecting deadlocks, infinite loops or any state the process cannot recover from on its own. The consequence is severe, so the bar should be high.
Readiness asks: should this container receive traffic? If the readiness probe fails, Kubernetes removes the pod from the service’s endpoint list. No traffic gets routed to it. The process keeps running. Use this for detecting degraded state the service might recover from: a slow upstream, a temporarily full connection pool or a cache warming up after a fresh deploy.
Startup asks: has this container finished initializing? While the startup probe is running, liveness and readiness probes are suspended. This matters enormously for slow-starting applications. A Spring Boot app that takes 45 seconds to initialize doesn’t have a configuration problem. It has a startup probe problem. Without a startup probe, the liveness probe kicks in before initialization finishes, fails immediately and kills the container. The pod enters a restart loop and you spend an hour debugging what should have been a two-line config.
Startup probes have been available in Kubernetes for years. Most teams I’ve seen still use initialDelaySeconds as a workaround, which is a blunt instrument. You pick a delay large enough that the app always finishes starting before the probe hits, then add a buffer because you're nervous, and end up with a 90-second window where a genuinely broken container keeps running before Kubernetes notices.
Use startup probes. Configure them with a generous failureThreshold and short periodSeconds so they give the app time to start while still catching actual startup failures quickly.
What “Ready” Actually Means
Readiness is not binary. It’s not “crashed” or “fine.” A service can be running, processing some requests, and completely unable to handle new ones.
The conditions that matter for readiness depend on your service, but the common ones look like this:
Database connectivity: Not just that the connection exists, but that it can execute a trivial query. A stale connection that’s been idle for hours might look healthy until the first query fails. A connection to a read replica that’s 10 minutes behind might be fine for some use cases and catastrophic for others.
Connection pool capacity: If your pool is at 100% utilization, new requests will queue, then time out. A pod in this state should be removed from rotation, not sent more traffic.
Background worker liveness: If your service depends on in-process workers (consumers, schedulers, async processors), their health is your health. A service that accepts HTTP requests but has a dead Kafka consumer is half a service. Route traffic to it and you’ll accumulate work with no processing.
Warm state after deploy: If your service caches data on startup, there’s a window after deploy where it’ll hammer the database on every request. That’s not ready. That’s a traffic spike waiting to happen.
None of this is captured by a function that returns {"status": "ok"}.
The Deep Check Paradox
The logical response to all of this is to make your health check more thorough. Add a database ping. Check the connection pool. Verify the worker threads. Return 503 if anything looks wrong.
This is the right instinct applied incorrectly.
Deep health checks that verify all dependencies have a specific failure mode: they turn optional dependencies into hard dependencies, and they can trigger cascading failures across your entire cluster.
Here’s the scenario. Your database is experiencing elevated latency, say 3 seconds per query instead of 30 milliseconds. Your deep health check includes a database query. The check takes 3 seconds. Kubernetes’s probe timeout is 1 second. The probe fails. Your readiness probe fails. Kubernetes removes the pod from rotation.
Now that pod’s traffic lands on the remaining pods. They’re under higher load. Their connection pools start queuing. Their health checks also start timing out. Kubernetes removes them too. You’ve turned a database that’s slow but functional into a complete service outage.
This is documented. It happens in production. The technical term is a cascading failure, and health checks are one of the quieter ways to trigger one.
The fix is not to remove the deep checks. It’s to use them in the right context.
Separating Signal From Noise
There’s a three-tier approach that works.
Tier 1: Liveness endpoint. Trivially fast. Returns 200 if the process is not deadlocked. No external calls. No database queries. This should complete in under 10 milliseconds.
@app.get("/health/live")
def liveness():
    # Check in-process state only: thread pool alive, no deadlock indicators
    return {"status": "alive"}
Tier 2: Readiness endpoint. Checks local state and critical dependencies, but with strict timeouts and fail-open logic. The key distinction: if a dependency check fails, the service should become not-ready only if it genuinely cannot serve requests without it. Non-critical dependencies that are degraded should be noted but should not block traffic.
@app.get("/health/ready")
async def readiness():
    checks = {}

# Check database with tight timeout
    try:
        async with asyncio.timeout(0.5):
            await db.execute("SELECT 1")
        checks["database"] = "ok"
    except Exception:
        checks["database"] = "unavailable"
        # Database is critical, fail readiness
        return JSONResponse(status_code=503, content={"status": "not_ready", "checks": checks})
    # Check connection pool utilization
    pool_usage = db.pool.size() / db.pool.maxsize
    if pool_usage > 0.9:
        checks["pool"] = f"saturated ({pool_usage:.0%})"
        return JSONResponse(status_code=503, content={"status": "not_ready", "checks": checks})
    checks["pool"] = "ok"
    return {"status": "ready", "checks": checks}
Tier 3: Deep diagnostic endpoint. Checks everything. Returns detailed dependency state. Never used by Kubernetes probes. Used by your monitoring system, your deployment pipeline and your on-call runbook. Not wired to load balancer decisions. This is your observability endpoint, not your control plane.
@app.get("/health/deep")
async def deep_check():
    # Checks all dependencies with longer timeouts
    # Returns full diagnostic payload
    # Never called by liveness or readiness probes
    results = await check_all_dependencies()
    return results
Configure your Kubernetes probes like this:
livenessProbe:
  httpGet:
    path: /health/live
    port: 8000
  initialDelaySeconds: 10
  periodSeconds: 15
  timeoutSeconds: 2
  failureThreshold: 3

readinessProbe:
  httpGet:
    path: /health/ready
    port: 8000
  initialDelaySeconds: 5
  periodSeconds: 10
  timeoutSeconds: 2
  failureThreshold: 2

startupProbe:
  httpGet:
    path: /health/live
    port: 8000
  failureThreshold: 30
  periodSeconds: 3
The startup probe gives the app up to 90 seconds to start (30 failures x 3 second period), after which the liveness probe takes over. For fast-starting apps, this has no downside. For slow-starting ones, it prevents the restart loop.
The Load Balancer Problem Outside Kubernetes
If you’re not on Kubernetes, you’re either using a cloud load balancer (ALB, DigitalOcean load balancers, Nginx upstream checks) or a reverse proxy doing health polling. The same split applies.
Most cloud load balancers poll a single health endpoint and remove the target if it fails. If that endpoint has a slow dependency check, you get the same cascade risk. Load balancer health check timeouts are typically short (a few seconds by default). If your database query exceeds that threshold, your instance gets deregistered. You’re one slow query away from an outage that your database can actually survive.
The same principle applies: your load balancer health check should be fast and local. Put the deep check behind a different path and poll it from your monitoring system, not your control plane.
The Graceful Shutdown Gap
One more place health checks fail: during shutdown. When a pod receives a SIGTERM signal, Kubernetes removes it from the endpoint list, but there’s a race condition. Requests already in flight hit the pod after it starts shutting down. The standard advice is to add a preStop sleep of a few seconds before the process stops accepting connections.
lifecycle:
  preStop:
    exec:
      command: ["sleep", "5"]
Your health check should also signal not-ready during shutdown before the process closes its connections. If it returns 503 the moment SIGTERM arrives, load balancers stop routing new requests faster, and in-flight requests have time to complete.
import signal

is_shutting_down = False
def handle_sigterm(*args):
    global is_shutting_down
    is_shutting_down = True
signal.signal(signal.SIGTERM, handle_sigterm)

@app.get("/health/ready")
async def readiness():
    if is_shutting_down:
        return JSONResponse(status_code=503, content={"status": "shutting_down"})
    # ... rest of checks
This is not in most health check tutorials. It’s also the reason you get 502 errors during rolling deployments when you’re sure you’ve done everything right.
What This Actually Requires
None of this is complicated in isolation. The reason teams skip it is that health checks feel like an afterthought. You wire up /health, it returns 200, the load balancer is happy and you move on to the feature work.
The cost shows up later, in a 3 AM incident where everything looks healthy but nothing is working, in a deployment that drops requests because the startup probe isn’t configured, in a database degradation that turns into a full outage because your readiness probes made Kubernetes panic.
The fix takes maybe two hours. Separate your liveness and readiness probes. Add a startup probe if your app takes more than 10 seconds to initialize. Make your readiness check test real local state with timeouts tight enough to fail fast. Move deep dependency checks to a separate endpoint that nothing load-balance-critical reads from. Handle SIGTERM explicitly.
Your /health endpoint that always returns 200 is not a health check. It’s a proof-of-concept for a health check.
Finish the implementation.