You recognized it in database queries. The same pattern has been hiding in your HTTP calls, your Redis lookups, and your LLM tool calls.
You profile your app. The ORM queries are clean. You added with() calls, killed the eager-loading issues, ran EXPLAIN ANALYZE until the query plan looked reasonable. Response time drops from 800ms to 320ms. You close the profiler, ship it, and call it fixed.
Then the next sprint, a teammate notices the endpoint is slow again under load. You profile again. Database queries look fine. The problem is somewhere else.
The N+1 pattern did not disappear. It moved.
What N+1 Actually Is
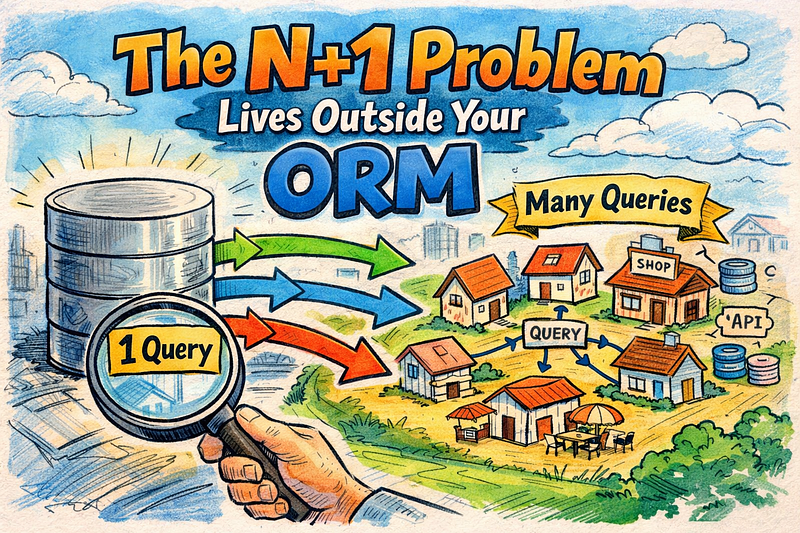
The database version is easy to spot in retrospect: fetch a list of 50 records, then issue one additional query per record to load a related resource. 51 queries where one would do. Every ORM tutorial warns you about it.
But the underlying pattern is simpler than any ORM-specific explanation. N+1 is what happens when you perform an operation one-by-one instead of in batch, and the per-operation overhead is non-trivial. In a database, that overhead is query parsing, index traversal, and transaction management. Multiplied by N, it becomes visible.
Databases are not the only place with non-trivial per-operation overhead. And that is the thing that most performance guides skip.
N+1 in HTTP Service Calls
This is the version that costs more than the database version and is discovered later. A network round-trip between services is not a local socket call. Even on the same VPC, you are paying for TCP handshakes, TLS negotiation, HTTP framing, and whatever your service mesh adds on top. A database query on a connection pool might cost 2ms. An internal HTTP call typically costs 10–50ms, and under load that number climbs, not drops.
Here is the naive version in a Laravel application that fetches a user list and then retrieves permissions for each one:
// N+1 in service calls (naive)
$users = User::all();

$permissions = [];
foreach ($users as $user) {
    // One HTTP call per user, executed sequentially
    $permissions[$user->id] = Http::get(
        "https://auth.internal/permissions/{$user->id}"
    )->json();
}
Twenty users means twenty sequential HTTP calls. Fifty means fifty. Each one blocks until it resolves. If the auth service takes 30ms per call, you have added 600ms to 1,500ms to your response time before you do anything else with the data.
The fix follows the same principle as eager loading, applied to HTTP: collect all the identifiers you need, make one batched call, distribute the results.
// Fixed: concurrent pool via Guzzle promises
use Illuminate\Http\Client\Pool;
use Illuminate\Support\Facades\Http;

$users = User::all();
$userIds = $users->pluck('id');
$responses = Http::pool(fn (Pool $pool) =>
    $userIds->map(fn ($id) =>
        $pool->as($id)->get("https://auth.internal/permissions/{$id}")
    )->all()
);
$permissions = [];
foreach ($users as $user) {
    $permissions[$user->id] = $responses[$user->id]->json();
}
Laravel’s Http::pool() uses Guzzle's MultiCurlHandler to fire all requests concurrently. Instead of waiting 30ms * N, you wait for the slowest single response. For fifty users, that is roughly 30-50ms total instead of 1,500ms. The auth service handles the same total load. You are just not forcing your application to sit in a single-file queue waiting for each one.
If your auth service does not expose a batch endpoint at all, that is worth addressing separately. A /permissions/batch endpoint that accepts an array of user IDs and returns a map is a cheap change with significant downstream impact. Concurrent calls with Http::pool() are a short-term fix. A proper batch endpoint is the right design.
One thing worth naming: the Http::pool() approach still sends N requests to the downstream service. You are cutting your waiting time, but you are not cutting the load you generate. If the auth service is already under pressure, pooling fifty simultaneous requests might push it over. The real fix is reducing request count at the source, not making them faster in parallel. Pool first, batch second, design the batch endpoint third. That is the progression.
N+1 in Redis Lookups
This one is quieter because Redis is fast. A single GET call to Redis on localhost is sub-millisecond. Developers look at per-call latency, decide it is not a problem, and move on.
But every GET is still a round-trip. If you are running Redis as a managed service in the same cloud region, each call might be 1–3ms. For a list operation fetching 200 cached records, that is 200–600ms in round-trips that do not need to exist.
The naive version:
# N+1 in Redis (naive)
import redis

r = redis.Redis(host='redis.internal', port=6379)
user_ids = [101, 102, 103, ..., 300]
permissions = {}
for user_id in user_ids:
    # One round-trip per user
    value = r.get(f"permissions:{user_id}")
    permissions[user_id] = value
Two hundred round-trips. Redis handles each in microseconds, but the network latency stacks across all of them.
The fix is MGET, Redis's built-in batch-get command. It fetches all requested keys in a single round-trip with O(N) time complexity where N is the number of keys requested:
# Fixed: single MGET round-trip
user_ids = [101, 102, 103, ..., 300]

keys = [f"permissions:{uid}" for uid in user_ids]
values = r.mget(keys)  # One network call, all values returned in order
# mget preserves key order. None for cache misses.
permissions = {
    uid: val
    for uid, val in zip(user_ids, values)
    if val is not None
}
# Handle cache misses separately: fall through to source of truth
The same pattern works in PHP. Laravel’s Redis facade exposes the equivalent:
// Laravel Redis mget
$keys = collect($userIds)->map(fn ($id) => "permissions:{$id}")->all();
$values = \Illuminate\Support\Facades\Redis::mget($keys);
Cache misses come back as null. Handle those separately. Either serve defaults or fall back to the origin data source.
N+1 in GraphQL Resolvers
If you have a GraphQL API, this variant is almost certainly present unless you deliberately built around it.
The structural problem: each field resolver executes independently. When a resolver for a nested field runs, it does not know what other instances of itself are running for adjacent nodes in the same response tree.
Request a list of ten orders, each with a customer name. The orders resolver runs once. The customer resolver runs ten times, one per order, each firing its own database or service call.
DataLoader, originally built at Facebook and now maintained in the graphql/dataloader project, solves this by coalescing all .load(key) calls that happen within a single event loop tick into a single batch function call. Your resolver calls dataloader.load(customerId) for each order. DataLoader waits until the current tick drains, then calls your batch function with the full array of customer IDs once. The N+1 becomes 2: one query for orders, one batch query for all associated customers.
The implementation requires restructuring your resolvers to route through DataLoader instances scoped to each request. It is not a drop-in fix. The performance difference on nested queries is worth the refactor.
N+1 in LLM Tool Calls
This is where the pattern is appearing now, and most teams building AI agents have not thought to look for it yet.
An LLM agent that has access to tools will call those tools in whatever sequence the model decides. If the agent is tasked with processing a list of records (summarizing ten support tickets, enriching twenty leads, checking twenty product IDs against an inventory service), a poorly designed tool interface will invite one-by-one calls.
The model sees a tool called get_product_details(product_id: str). It calls it twenty times. Each tool call is an external API request with its own latency and rate-limit accounting.
The fix is the same as everywhere else: expose a batch tool. A function called get_product_details_batch(product_ids: list[str]) changes the model's options. A well-prompted agent will prefer the batch version when it is available, and you can constrain the system prompt to reinforce that preference.
In agentic frameworks that give you middleware hooks, you can also implement coalescing at the tool-call layer: detect sequential calls to the same tool with different arguments and batch them before execution. This is worth building for high-volume pipelines where prompt-level batching hints are not reliable enough.
The detection signal is the same as everywhere else: log tool call counts per agent run and graph them against input list size. If calling the agent with 5 items produces 5 tool calls of the same type, and 50 items produces 50, the batch tool either does not exist or the model is not using it. Both are fixable.
How to Find It
The N+1 pattern has a consistent signature in observability data. Here is the detection sequence:
- Open your distributed trace for the slow endpoint. Count the outbound call spans: HTTP, Redis, database and external APIs.
- Rerun the same endpoint with a smaller input (10 records instead of 50) and count again. If the span count scales with the input size, you have an N+1.
- Look at the span names. Repeated operations with the same URL pattern, same Redis key prefix, or same table name point to the loop.
- Check whether the operations are sequential (each starts after the previous one completes) or concurrent (they overlap in the trace). Sequential N+1 in HTTP calls is expensive and fixable with pooling. Concurrent N+1 in HTTP calls is cheaper but still a symptom that a batch endpoint would eliminate entirely.
The simplest persistent diagnostic: log the count of outbound calls per request and graph it against the size of the response payload. A linear correlation is a problem. A flat line, regardless of how many records you return, means your batching is working.
OpenTelemetry makes this readable because parent-child span relationships show you the call site directly. Without distributed tracing, you are reduced to counting log lines, which is slower and less reliable. Invest in the instrumentation before it is a crisis.
A practical threshold: if any single request generates more than 10 outbound calls of the same type, treat that as an automatic investigation trigger. Ten is not a hard limit, but it is a useful number. Below that, the overhead is usually acceptable. Above it, you are almost always in N+1 territory and the fix will be straightforward once you find it.
The Pattern Outlasts Every Fix
You solve the database N+1. A month later you find it in HTTP calls. You solve that. Six months later an engineer writes a new Redis cache lookup in a loop. The pattern keeps returning because the instinct to write a loop is natural and the cost is invisible until the system is under pressure.
The lasting solution is not the refactoring. It is building the detection into your observability setup so the next occurrence is caught before it reaches production. Span count per response record is a metric worth tracking continuously. The N+1 will show itself in that graph before it shows itself in a customer complaint.
Track span count per response record. When that number climbs, you know where to look.
Thank you for being a part of the community
Before you go:
Whenever you’re ready
There are 4 ways we can help you become a great backend engineer:
- The MB Platform: Join thousands of backend engineers learning backend engineering. Build real-world backend projects, learn from expert-vetted courses and roadmaps, track your learning and set schedules, and solve backend engineering tasks, exercises, and challenges.
- The MB Academy: The “MB Academy” is a 6-month intensive Advanced Backend Engineering Boot Camp to produce great backend engineers.
- Join Backend Weekly: If you like posts like this, you will absolutely enjoy our exclusive weekly newsletter, sharing exclusive backend engineering resources to help you become a great Backend Engineer.
- Get Backend Jobs: Find over 2,000+ Tailored International Remote Backend Jobs or Reach 50,000+ backend engineers on the #1 Backend Engineering Job Board.