You can measure it, manage it or mostly ignore it. The replica does not wait for you to decide.
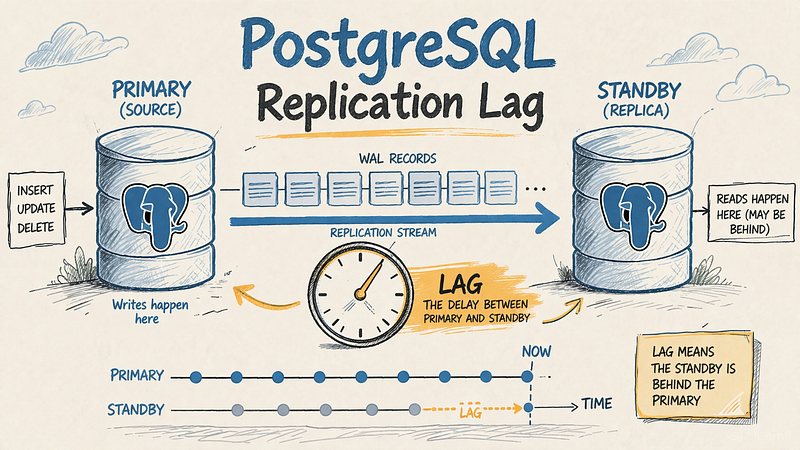
A user submits a form. Your application writes the new record to the primary. Your load balancer routes the next request to a read replica. The replica is 600 milliseconds behind. The record does not exist yet.
The user sees a blank list. They resubmit. Now the record exists twice.
This is not a PostgreSQL bug. It is the expected behaviour of asynchronous streaming replication, and it happens in every setup where you use read replicas without accounting for lag. Most engineers reach for replicas to reduce load on the primary. Fewer understand what they are trading for it, and fewer still have thought through what to do when the trade bites them.
This guide covers how replication lag actually accumulates, how to measure it precisely and four patterns for handling it in application code. One of those patterns gets skipped by most tutorials because it involves a PostgreSQL parameter that sounds minor and is not.
How WAL Streaming Replication Actually Works
PostgreSQL replication begins at the Write-Ahead Log. Every INSERT, UPDATE, DELETE and schema change is written to the WAL on the primary before it is considered committed. The primary’s WAL sender process streams those WAL records to the standby’s WAL receiver over a persistent TCP connection.
The standby has two jobs: receive the WAL and replay it. Receiving and replaying are not the same step. There is a startup process on the standby that applies WAL records to the standby’s data files. Until that step completes, a query on the standby cannot see the change.
This produces three distinct lag measurements, all visible in the pg_stat_replication view on the primary:
- write_lag: Time between the primary writing a WAL record and the standby acknowledging it was written to the standby’s own WAL buffer.
- flush_lag: Time until the standby has flushed that WAL to its disk (durable, but not yet replayed).
- replay_lag: Time until the standby has applied the WAL record and the change is visible to queries on the standby.
replay_lag is the number you care about for application correctness. A query running on the standby can only see changes whose replay has completed.
Measuring Lag in Production
From the primary
-- Run on the primary to see all connected standbys
SELECT
    application_name,
    state,
    EXTRACT(EPOCH FROM write_lag)::int  AS write_lag_s,
    EXTRACT(EPOCH FROM flush_lag)::int  AS flush_lag_s,
    EXTRACT(EPOCH FROM replay_lag)::int AS replay_lag_s,
    sync_state
FROM pg_stat_replication
ORDER BY replay_lag DESC NULLS LAST;
The sync_state column tells you whether the standby is async, sync, quorum or potential. All the lag problems covered in this guide apply to async standbys, which is the default.
From the standby itself
The pg_stat_replication view only exists on the primary. To measure lag from the standby, use pg_last_xact_replay_timestamp():
-- Run on the standby
-- Accounts for low-write periods where the timestamp would stall
SELECT
    CASE
        WHEN pg_last_wal_receive_lsn() = pg_last_wal_replay_lsn()
        THEN 0
        ELSE EXTRACT(EPOCH FROM (now() - pg_last_xact_replay_timestamp()))
    END AS lag_seconds;
The CASE block is necessary. If the primary has no new writes, the timestamp from pg_last_xact_replay_timestamp() stops advancing. Without the guard, your monitoring would report growing lag even when replication is healthy and idle.
A lag_seconds value above 10 on a busy system is worth investigating. Above 60, your application is almost certainly serving meaningfully stale data.
The Read-Your-Own-Writes Problem
Replication lag becomes a correctness problem when users interact with data they just wrote. The sequence is:
- User sends a write. Your application routes it to the primary. Primary commits.
- User’s next request arrives. Load balancer routes it to a replica.
- Replica has not applied the WAL for the write yet.
- User sees their change missing, or worse, sees an outdated version that conflicts with what they just did.
This is the read-your-own-writes problem. It is architectural rather than incidental. Any async replication setup has it by default, regardless of how small the lag normally is. Small lag means it is rare, not that it does not happen.
The synchronous_commit Decision Matrix
PostgreSQL’s synchronous_commit parameter controls what the primary waits for before returning success to the client. The five settings have different durability and performance characteristics:
off: Waits for nothing beyond the local WAL buffer. Fastest write throughput, but a primary crash can lose the last few committed transactions. No effect on standby visibility.
local: Waits for the primary to flush WAL to its own disk. Protects against primary memory loss. No effect on standby visibility.
on (default): Waits for a synchronous standby to acknowledge receipt and flush its WAL to disk. Adds one network round trip to every commit. Data is still not immediately readable on the standby.
remote_write: Waits for the standby to write WAL to its OS buffer (not yet fsynced to disk). Marginally faster than on with slightly weaker durability. Still no read guarantee on the standby.
remote_apply: Waits for the standby to fully replay the WAL, making the change visible to queries on that standby. The only setting that gives you read-your-own-writes on a synchronous replica. Every commit pays the network round trip plus standby replay time.
Whether data is visible on the standby after commit is the dimension engineers miss. Only remote_apply guarantees that a committed write is immediately readable on the standby that received it. Every other setting still leaves a window where the standby is behind, even if that window is tiny for remote_write.
remote_apply is the right choice for critical paths where you need read-your-own-writes guarantees on a specific synchronous standby. It costs meaningful write latency: every commit waits for WAL to travel to the standby and be replayed, which includes the network round trip plus the standby's apply time. On a low-latency LAN, this can be 2-5 ms per commit. On a cross-region standby, it can be 30-100 ms.
You can set it per transaction, which makes it practical:
-- Only pay the remote_apply cost on writes where you need it
BEGIN;
SET LOCAL synchronous_commit = remote_apply;
INSERT INTO orders (user_id, total) VALUES ($1, $2);
COMMIT;
On the next read, route to the synchronous standby that just applied this WAL and the record is guaranteed to be there.
4 Patterns to Handle Lag in Application Code
Pattern 1: Route writes and their immediate reads to the primary
The simplest fix is the most obvious one: if a request writes data and immediately reads it back, send both to the primary. In Django, a custom database router combined with a thread-local flag achieves this without changing any query code:
import threading

# Thread-local flag set after any write, cleared at the end of the request
_write_flag = threading.local()
class WriteAwareRouter:
    """Route reads to the primary for a short window after any write."""
    def db_for_read(self, model, **hints):
        if getattr(_write_flag, 'active', False):
            return 'default'  # primary
        return 'replica'
    def db_for_write(self, model, **hints):
        return 'default'  # always primary

def set_primary_read_window():
    """Call this immediately after committing any write in the same thread."""
    _write_flag.active = True

def clear_primary_read_window():
    """Call this in request middleware at the end of each request cycle."""
    _write_flag.active = False
Call set_primary_read_window() after committing any write. Call clear_primary_read_window() in a response middleware so the flag resets between requests. This is coarse but effective and requires no changes to your SQL or ORM queries.
Pattern 2: LSN-based consistency tokens
A more precise approach uses PostgreSQL’s Log Sequence Number (LSN) to give the client a read guarantee. After a write on the primary, capture the current WAL position:
-- Run immediately after your INSERT/UPDATE/DELETE on the primary
SELECT pg_current_wal_lsn() AS write_lsn;
Store this value in the user’s session, a cookie, or a response header. On the next read, before routing to a replica, check whether the replica has caught up to that position:
-- Run on the replica before executing the user's actual query
SELECT pg_last_wal_replay_lsn() >= $1::pg_lsn AS is_caught_up;
If is_caught_up is false, route the read to the primary instead. Once the user's LSN has passed, you can safely route to replicas again.
This is the pattern Bitbucket uses for their distributed database layer. PostgreSQL 19 (planned for September 2026) is expected to add a native WAIT FOR LSN command that eliminates the need for this polling check.
Pattern 3: Replica minimum lag threshold
For workloads where you are willing to tolerate some staleness but want a bound on how stale, use the standby query from the measurement section as a routing gate:
LAG_QUERY = """
    SELECT CASE
        WHEN pg_last_wal_receive_lsn() = pg_last_wal_replay_lsn()
        THEN 0
        ELSE EXTRACT(EPOCH FROM (now() - pg_last_xact_replay_timestamp()))
    END AS lag_seconds
"""

def get_db_connection(require_freshness_seconds: int = 0):
    if require_freshness_seconds == 0:
        return replica_pool.get_connection()

    # Do not use a context manager here: returning inside `with` would close
    # the connection before the caller can use it.
    conn = replica_pool.get_connection()
    lag = conn.execute(LAG_QUERY).scalar()

    # lag is None when no transactions have been replayed yet (fresh standby)
    if lag is not None and lag <= require_freshness_seconds:
        return conn
    conn.close()  # return to pool; fall back to primary
    return primary_pool.get_connection()
This is cheap to run (a single row, no I/O) and lets you express freshness requirements per query without coupling your routing logic to specific LSN values.
Pattern 4: Accept the lag, fix the symptom
Not every stale read is a correctness bug. A dashboard that shows record counts 2 seconds behind is fine. A checkout flow that shows an outdated inventory count is not. Classify your reads before you apply any of the patterns above.
The rule is: any read whose result can drive a write needs one of the first three patterns. Analytics reads, aggregate dashboards and historical data displays can usually tolerate replica lag without remediation.
Replication Slots: The Silent Disk Killer
Replication slots are how PostgreSQL tracks how far each consumer has consumed the WAL. The primary will not discard any WAL that a slot still needs.
This is a safety mechanism until it is not. If a replica falls behind and stops consuming (because it crashed, was decommissioned or because a CDC connector was paused), the primary keeps accumulating WAL in the pg_wal directory. On a write-heavy database, this directory can grow by tens of gigabytes per hour. When the disk fills, the primary cannot write new WAL and goes down.
This failure mode has a name in PostgreSQL operations circles: “slot suicide.” The replica takes the primary down with it.
Check your inactive slots and their WAL retention regularly:
-- Run on the primary
-- Any inactive slot with large wal_retained is a ticking clock
SELECT
    slot_name,
    slot_type,
    active,
    pg_size_pretty(
        pg_wal_lsn_diff(pg_current_wal_lsn(), restart_lsn)
    ) AS wal_retained
FROM pg_replication_slots
ORDER BY pg_wal_lsn_diff(pg_current_wal_lsn(), restart_lsn) DESC;
To set a hard cap on WAL accumulation, add this to postgresql.conf (available since PostgreSQL 13):
# Set a maximum WAL size that any slot can retain
# If a slot falls further behind, it is invalidated rather than filling the disk
# -1 (the default) means no limit
max_slot_wal_keep_size = 10GB
Setting max_slot_wal_keep_size does not prevent the slot lag from growing. It sets the point at which the primary gives up on the slot and invalidates it, allowing WAL cleanup to proceed. A replica that falls this far behind needs manual intervention regardless.
What to Alert On
Three signals cover most replication lag emergencies in production:
Replica replay lag above threshold. Run the standby lag query on a cron and alert when lag_seconds > 30. The threshold depends on your application's tolerance, but anything above 60 seconds should page someone.
Inactive replication slots with retained WAL. Any row in pg_replication_slots where active = false and wal_retained is larger than a few gigabytes needs attention. Do not let this silently grow overnight.
WAL directory size approaching disk capacity. Alert at 70% disk usage on the volume holding pg_wal. By the time you hit 90%, the window for intervention is already narrow.
PostgreSQL 18.x does not emit log warnings for replication slot lag by default. You need to build these alerts yourself. A Prometheus exporter with postgres_exporter covers all three with the right configuration.
The Part Nobody Writes Until Production is on Fire
Most replication lag guides stop at “set synchronous_commit = on." That advice is about durability (not losing data on primary failure) and says nothing about read consistency on the standby.
The confusion is understandable. Both problems involve replicas. The fixes are different. Durability is controlled by synchronous_commit. Read consistency is an application-layer problem that synchronous_commit only partially addresses, and only at the cost of every write waiting for a remote apply.
The practical answer for most applications is Pattern 1 (pin post-write reads to primary) combined with the slot monitoring query as a standing cron job. The other patterns matter when you have enough read traffic to justify the operational complexity, or when your standby is far enough away that primary fallback is expensive.
Replication lag is not a bug. It is a design parameter you probably have not consciously set.
Set it now, before the user sees their record missing.