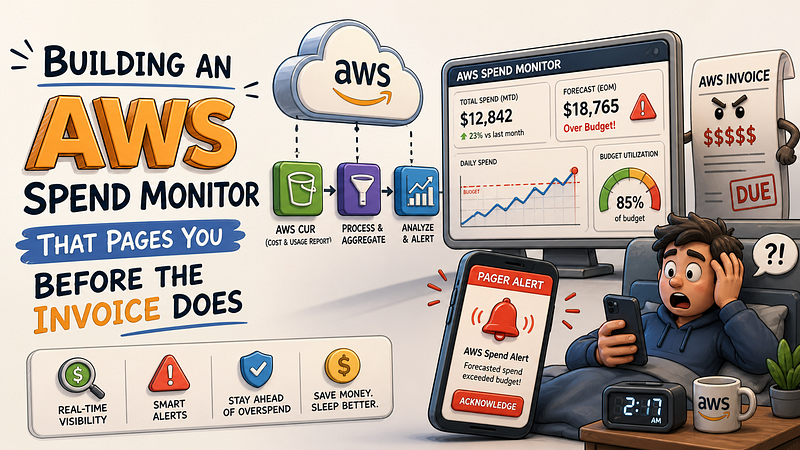
How to wire Cost Allocation Tags, the Cost Explorer API and anomaly detection into a visibility stack that catches runaway spend while it’s still reversible
TLDR; Well, you might say its totally unnecessary. Well, i do it anyway. Experiment is my niche!.
The Lambda function your team ships in Tuesday’s deployment costs $0.0000166667 per request. At ten requests per second, that’s $4.33 a day, $130 a month. Cheap. Invisible. Fine.
At 10,000 requests per second after the product review goes viral, that’s $4,325 a month, and nobody changed a line of infrastructure code to make it happen. The bill changed because traffic changed. Your alerting system didn’t know about it. Your budget didn’t account for it. Finance will ask about it in thirty days.
This is not a billing problem. It’s an instrumentation problem. And it lives in your architecture, not your spreadsheet.
The Three Places Cloud Costs Live (and the One Most Teams Ignore)
Every cloud bill has three sources of surprise:
Unexpected scale: a service sees ten times normal traffic and you pay for ten times normal compute. Expected, manageable, predictable if you’re watching.
Unexpected services: something your code touches has costs you didn’t model. Data transfer between Availability Zones. CloudWatch Logs ingestion from a verbose logger. S3 request costs from an image processor that retries. These are invisible at deploy time.
Forgotten resources: a test environment, a Load Balancer attached to nothing, a NAT Gateway that nobody needs anymore. These persist until someone audits.
The first category is what teams tend to solve with autoscaling limits and capacity planning. The second and third categories are where the surprises come from. And neither of them shows up in your application metrics.
The architecture problem is simple to state: your code produces costs, but there is no signal path from your code to your billing system. You cannot attach a cost sensor to a deploy the way you attach a latency sensor. So costs accumulate silently, and the only feedback loop is a monthly invoice.
You can build a tighter feedback loop. It requires three layers.
Layer 1: Cost Allocation Tags
A Cost Allocation Tag is a key-value pair you attach to any AWS resource. Once you activate it in the Billing console, AWS uses it to group line items on your cost reports. Tag an EC2 instance with Environment: production and Feature: payments and you can query the Cost Explorer API and ask "how much did the payments feature cost this month in production?" and get a real answer.
Without tags, you get service-level totals. With tags, you get feature-level attribution.
The catch: tags are not retroactive. Once you activate them in the Billing and Cost Management console, tags take up to 24 hours to appear in Cost Explorer. Tags applied today will not appear on last month’s bill. This means tagging strategy is a decision you make before costs become a problem, not after.
What to tag (in priority order):
- Environment:
production,staging,dev. This alone makes the "why did we spend $800 on an RDS instance?" conversation dramatically shorter. - Feature or Service: the product or bounded context that owns the resource.
payments,notifications,auth. Keep values stable. Renaming them breaks historical cost queries. - Team or Owner: useful in multi-team accounts. Maps spending to accountability.
- CostCenter: required if your finance team does chargeback. Optional otherwise.
What not to tag:
Tagging at too high a cardinality makes CloudWatch billing expensive and Cost Explorer reports unreadable. Do not tag with request IDs, user IDs or deployment SHA values. These make every resource unique and defeat the grouping purpose.
The apply-at-create discipline matters more than the schema. A tag that gets added to half your resources tells you nothing about the other half. Make tag application part of your Terraform module defaults or your CDK constructs, not a manual step.
Layer 2: The Cost Explorer API
Once tags exist, you can query actual spend programmatically. The Cost Explorer API lets you pull daily or monthly cost data grouped by tag value, service or account. This is where you build the first automated signal.
A daily cost report script that runs as a scheduled Lambda looks like this:
import boto3
from datetime import datetime, timedelta

def get_daily_costs_by_feature(start: str, end: str) -> dict:
    """
    Query daily costs grouped by the 'Feature' cost allocation tag.
    Returns a dict mapping feature name to AmortizedCost for the period.
    """
    client = boto3.client("ce", region_name="us-east-1")
    response = client.get_cost_and_usage(
        TimePeriod={
            "Start": start,  # inclusive, format: "YYYY-MM-DD"
            "End": end,       # exclusive
        },
        Granularity="DAILY",
        Filter={
            "Dimensions": {
                "Key": "SERVICE",
                "Values": [
                    "AWS Lambda",
                    "Amazon RDS",
                    "Amazon EC2",
                    "Amazon S3",
                ],
                "MatchOptions": ["EQUALS"],
            }
        },
        Metrics=["AmortizedCost"],
        GroupBy=[
            {
                "Type": "TAG",
                "Key": "Feature",
            }
        ],
    )
    results = {}
    for group in response["ResultsByTime"]:
        for item in group["Groups"]:
            tag_value = item["Keys"][0].replace("Feature$", "")
            cost = float(item["Metrics"]["AmortizedCost"]["Amount"])
            results[tag_value] = results.get(tag_value, 0.0) + cost
    return results

if __name__ == "__main__":
    today = datetime.utcnow().date()
    yesterday = today - timedelta(days=1)
    costs = get_daily_costs_by_feature(
        start=str(yesterday),
        end=str(today),
    )
    for feature, amount in sorted(costs.items(), key=lambda x: x[1], reverse=True):
        print(f"{feature:30} ${amount:.4f}")
A few things worth noting about that code. The Filter parameter narrows the query to services that actually matter for your stack. Querying every service line item is slow and expensive. The GroupBy with Type: "TAG" only works if the tag key is activated as a cost allocation tag. And the tag values come back prefixed with the key name (Feature$payments), which is why the replace call is there.
The Cost Explorer API is not free. Each call costs $0.01, which makes the scheduling decision obvious: a Lambda running this query once a day costs $0.30 a month, while running it every hour climbs to $7.20. The query returns the same billing data regardless of frequency, because the underlying Cost Explorer data only updates once or twice a day. Batch your queries and keep granularity at DAILY unless you have a specific reason for HOURLY.
Layer 3: AWS Cost Anomaly Detection
The first two layers give you data you query. This layer gives you alerts you didn’t have to ask for.
AWS Cost Anomaly Detection uses machine learning to build a baseline of your typical spending pattern, accounting for day-of-week seasonality and gradual growth, and pages you when actual spend deviates from that baseline by more than a threshold you define.
You configure it through three objects:
Monitor: defines what to watch. You can watch all services, a specific service, a linked account or a cost category. A tag-based monitor watches spend grouped by a specific tag key.
Subscription: defines who gets notified and under what conditions. You set a dollar threshold (only alert when the anomaly impact exceeds $100, for example) and a delivery channel (email or SNS topic).
Alert frequency: individual alerts per anomaly, or a daily summary. Individual alerts are more responsive. Daily summaries reduce noise.
The latency is real and worth understanding. The underlying data comes from Cost Explorer, which has up to 24-hour data latency. Cost Anomaly Detection runs approximately three times per day against that data, which means the worst-case time from anomalous spend to alert is roughly 24 to 36 hours. This is not a real-time system. It’s a drift detection system.
For most budget anomalies, 24 hours is fine. A runaway Lambda that costs $200 extra per day is caught before it costs $400. A misconfigured NAT Gateway leaking $50 per day gets caught within two days of the misconfiguration.
Where it fails is sudden spikes from a single event. If a DDoS attack or a runaway batch job generates $3,000 of compute cost in two hours, Cost Anomaly Detection will not alert you in time to stop it. That class of problem needs real-time billing alarms, which is what AWS Budgets handles.
Budget Alerts: The Hard Ceiling
A Budget is a threshold. Cross it and AWS fires a notification. Set a Budget per service, per account or per cost category. Budgets can trigger on actual spend or forecasted spend.
The boto3 setup looks like this:
import boto3

def create_feature_budget(
    account_id: str,
    feature_name: str,
    monthly_limit_usd: float,
    sns_topic_arn: str,
) -> None:
    """
    Create a monthly budget for a tagged feature with SNS alert at 80% and 100%.
    Requires Cost Allocation Tag 'Feature' to be active.
    """
    client = boto3.client("budgets", region_name="us-east-1")
    client.create_budget(
        AccountId=account_id,
        Budget={
            "BudgetName": f"feature-{feature_name}-monthly",
            "BudgetLimit": {
                "Amount": str(monthly_limit_usd),
                "Unit": "USD",
            },
            "CostFilters": {
                "TagKeyValue": [f"user:Feature${feature_name}"],
            },
            "TimeUnit": "MONTHLY",
            "BudgetType": "COST",
        },
        NotificationsWithSubscribers=[
            {
                "Notification": {
                    "NotificationType": "ACTUAL",
                    "ComparisonOperator": "GREATER_THAN",
                    "Threshold": 80.0,
                    "ThresholdType": "PERCENTAGE",
                },
                "Subscribers": [
                    {
                        "SubscriptionType": "SNS",
                        "Address": sns_topic_arn,
                    }
                ],
            },
            {
                "Notification": {
                    "NotificationType": "FORECASTED",
                    "ComparisonOperator": "GREATER_THAN",
                    "Threshold": 100.0,
                    "ThresholdType": "PERCENTAGE",
                },
                "Subscribers": [
                    {
                        "SubscriptionType": "SNS",
                        "Address": sns_topic_arn,
                    }
                ],
            },
        ],
    )
The CostFilters field for tag-based budgets uses the format user:TagKey$TagValue. The user: prefix is required for user-defined tags. The notification at 80% actual spend gives you a warning before you breach. The notification at 100% forecasted spend gives you time to act before you actually breach.
One limit to know: a budget can have up to five notifications.
What a Real Alert Actually Looks Like
Once the budget and anomaly monitors are wired up, the question becomes: what happens when something fires?
An SNS notification from a budget threshold hits your topic with a JSON payload that includes the budget name, the alert threshold type (ACTUAL or FORECASTED), the current amount spent and the budget limit. From there you route it wherever your team is watching: a Lambda that posts to Slack, a PagerDuty integration, an email to whoever owns that feature.
The budget name matters here. If you named your budget feature-payments-monthly, the alert immediately tells you which feature is over threshold. Compare that to the alternative: a generic "AWS billing alert for account 123456789" that leaves you logging into Cost Explorer to figure out what happened.
An anomaly alert is more detailed. It includes the anomaly ID, the root cause ranked by dollar impact across four dimensions (service, account, region and usage type), the expected spend, the actual spend and the impact amount. AWS runs the root cause analysis for you. When the notification arrives, you already know whether it was Lambda execution time, EC2 instance hours, RDS storage or data transfer that caused the spike.
The actionable alert is the one that names the problem. Name your resources well and the alert names the problem for you.
The Scale Question: When Does This Get Expensive?
Building this stack for a small team with a single AWS account costs almost nothing to operate.
Cost Anomaly Detection has no per-alert cost. The service itself is free. You pay for SNS message delivery, which is fractions of a cent per notification. A team receiving ten anomaly alerts a month pays less than a dollar in SNS costs.
AWS Budgets charges $0.02 per budget per month after the first two budgets. Ten feature budgets costs $0.16 a month.
The Cost Explorer API is the only meaningful cost: $0.01 per API request. A daily report costs $0.30 a month. A report with multiple tag-grouped queries, batched into one Lambda execution, stays under $1 a month for almost any team.
CloudWatch custom metrics are where costs can accumulate if you are not careful about dimension cardinality. Fifty well-scoped metrics costs $15 a month. Five hundred metrics (because someone added a high-cardinality dimension) costs $150 a month. The design principle is to keep dimensions bounded.
The full stack, properly configured: under $20 a month for most teams. The first month it catches a runaway service, it pays for itself.
The CloudWatch Metric Approach (When You Need Sub-Day Granularity)
Cost Explorer and Anomaly Detection both operate on billing data with up to 24-hour latency. If your system needs faster feedback, you can publish cost-proxy metrics to CloudWatch directly from your application.
This does not mean tracking actual dollars. It means tracking the usage signals that translate to dollars. Lambda invocation count is a cost proxy. S3 PutObject call count is a cost proxy. Bytes sent to CloudWatch Logs is a cost proxy.
A CloudWatch custom metric costs $0.30 per unique metric per month. The catch is that dimensions are multiplicative: publish the same metric name for ten Lambda functions across three environments and you have 30 unique billable metrics. Add a StatusCode dimension and you're at 90.
The design principle: keep dimension cardinality low. Two or three dimensions per metric is the practical ceiling for cost-effectiveness. Tag by Feature and Environment. Do not tag by RequestID or UserID.
When CloudWatch metrics make sense:
- You need near-real-time spend signals (under one hour)
- You’re tracking a single expensive operation like a generative AI inference call
- The cost signal belongs in the same dashboard as your latency and error rate data
When they don’t:
- Historical month-over-month cost analysis is what you need (use Cost Explorer instead)
- You need anomaly detection without manual threshold setting (Cost Anomaly Detection handles this with no per-metric configuration)
- Fine-grained per-feature attribution across all AWS services is the goal (tags plus Cost Explorer give you this for free)
The Architecture Decision: What Actually Gets Built
Pulling this together into a deployable stack:
Minimum viable configuration:
- Cost Allocation Tags applied to all production resources (Environment + Feature)
- A single Cost Anomaly Detection monitor watching all services, with a $50 anomaly impact threshold
- An Anomaly Detection subscription routing to an SNS topic your on-call rotation already watches
- Monthly budgets per environment (one for production, one for staging) with alerts at 80% and 100%
This catches the most common surprises: a service spike, a forgotten resource accumulating costs, an unexpected traffic increase. Zero operational overhead once configured.
Extended configuration (for teams who care about per-feature attribution):
- Cost Explorer scheduled query Lambda running nightly, pushing results to a shared Slack channel or internal dashboard
- Feature-level budgets for the three or four most expensive features
- CloudWatch cost-proxy metrics for your one genuinely expensive operation (if you have one)
What this stack deliberately does not solve:
Real-time billing alarms for sudden events. If a single Lambda invocation loop can generate $500 of compute before a 24-hour anomaly detector catches it, you need a different control: Lambda concurrency limits, SQS queue depth limits or reserved capacity that physically cannot scale past a threshold. The cost visibility stack is an after-the-fact observer. It does not prevent runaway spend. It reduces the time between runaway spend and human awareness.
Egress cost attribution. Data transfer costs in AWS are notoriously hard to attribute to a specific feature or service without VPC flow log analysis and custom tooling. Cost Allocation Tags do not propagate to data transfer line items the way they do to compute and storage. If egress is a meaningful cost driver, you need dedicated tooling.
The Tagging Problem Is a Discipline Problem
The hardest part of this entire stack is not the API. The hardest part is maintaining tag coverage across every deploy, every environment and every engineer.
A few patterns that hold up in practice:
Enforce tags at the Terraform module level, not the resource level. If every module that creates an EC2 instance requires var.environment and var.feature as inputs, the tags flow automatically. Tags become part of the contract for deploying infrastructure, not an afterthought.
Set an SCP (Service Control Policy) that rejects resource creation without mandatory tags. AWS Organizations supports policies that block API calls missing required tag keys. This converts a convention into a hard constraint. You will break the first deploy that violates it. That is the point.
Audit monthly, not annually. aws ce get-cost-and-usage with a monthly granularity and no GroupBy returns all untagged costs as ${"aws-created-resources"} or blank tag values. Run that query every month. The cost of untagged resources tells you how much visibility you're missing.
Closing
The cost review conversation that happens after the invoice arrives is always the wrong conversation. You’re explaining historical spend you can no longer change. The goal of this stack is to move that conversation to the week of the deploy, when the spend is small and the code change is fresh.
Tags at create time. Anomaly alerts on SNS. Budget thresholds before the month closes. None of it is complicated. All of it is optional until the day it isn’t.